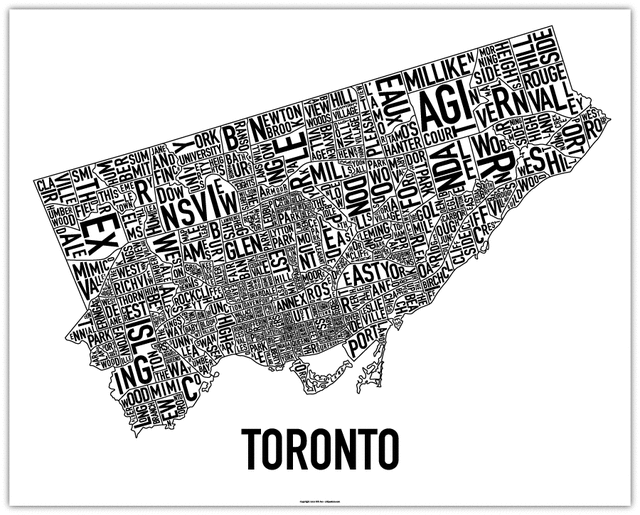
Toronto Neighbourhoods Under The Scope: September 2014 vs. September 2013
Find your neighbourhood below and see how September’s sales stats stacked up to last year’s.
C02 (Annex, Wychwood, Casa Loma, Yonge-St.Clair)
| Sept 2013 | Sept 2014 | % Change | |
| Active Listings | 270 | 246 | – 8.9% |
| Sales | 67 | 61 | – 9.0% |
| Average Price | $954,852 | $1,261,759 | + 32.1% |
| Days on Market | 21 | 31 | + 47.6% |
| Avg % of List Price | 101 | 98 | – 3.0% |
C03 (Forest Hill South, Cedarvale-Humewood, Oakwood-Vaughan, Yonge-Eglinton)
| Sept 2013 | Sept 2014 | % Change | |
| Active Listings | 132 | 137 | + 3.8% |
| Sales | 32 | 47 | + 46.9% |
| Average Price | $1,237,909 | $1,295,701 | + 4.7% |
| Days on Market | 27 | 19 | – 29.6% |
| Avg % of List Price | 100 | 100 | 0% |
C04 (Forest Hill North, Lawrence Park North/South, Bedford Park-Nortown, Englemount-Lawrence)
| Sept 2013 | Sept 2014 | % Change | |
| Active Listings | 267 | 209 | – 21.7% |
| Sales | 81 | 85 | + 4.9% |
| Average Price | $1,251,028 | $1,309,886 | + 4.7% |
| Days on Market | 22 | 20 | – 9.1% |
| Avg % of List Price | 99 | 100 | + 1.0% |
C06 (Clanton Park, Bathurst Manor)
| Sept 2013 | Sept 2014 | % Change | |
| Active Listings | 102 | 119 | + 16.7% |
| Sales | 25 | 30 | + 20.0% |
| Average Price | $586,062 | $625,632 | + 6.8% |
| Days on Market | 32 | 36 | + 12.5% |
| Avg % of List Price | 98 | 97 | – 1.0% |
C07 (Lansing-Westgate, Willowdale West, Newtonbrook West, Westminster-Branson)
| Sept 2013 | Sept 2014 | % Change | |
| Active Listings | 354 | 321 | – 9.3% |
| Sales | 88 | 109 | + 23.9% |
| Average Price | $584,719 | $645,286 | + 10.4% |
| Days on Market | 31 | 33 | + 6.5% |
| Avg % of List Price | 98 | 98 | 0% |
C09 (Rosedale-Moore Park)
| Sept 2013 | Sept 2014 | % Change | |
| Active Listings | 81 | 97 | + 19.8% |
| Sales | 24 | 25 | + 4.2% |
| Average Price | $1,209,973 | $1,501,960 | + 24.1% |
| Days on Market | 18 | 16 | – 11.1% |
| Avg % of List Price | 98 | 100 | + 2.0% |
C10 (Mount Pleasant East/West)
| Sept 2013 | Sept 2014 | % Change | |
| Active Listings | 103 | 123 | + 19.4% |
| Sales | 37 | 39 | + 5.4% |
| Average Price | $742,080 | $691,039 | – 6.9% |
| Days on Market | 17 | 26 | + 52.9% |
| Avg % of List Price | 101 | 103 | + 2.0% |
C11 (Leaside, Thorncliffe Park, Flemingdon Park)
| Sept 2013 | Sept 2014 | % Change | |
| Active Listings | 74 | 72 | – 2.8% |
| Sales | 38 | 48 | + 26.3% |
| Average Price | $675,600 | $748,062 | + 10.7% |
| Days on Market | 29 | 19 | – 34.5% |
| Avg % of List Price | 100 | 103 | + 3.0% |
C12 (St. Andrew-Windfields, Bridle Path-Sunnybrook-York Mills )
| Sept 2013 | Sept 2014 | % Change | |
| Active Listings | 160 | 169 | + 5.6% |
| Sales | 45 | 37 | – 17.8% |
| Average Price | $2,191,755 | $2,058,908 | – 6.1% |
| Days on Market | 45 | 24 | – 46.7% |
| Avg % of List Price | 96 | 96 | 0% |
C13 (Banbury-Don MIlls, Parkwoods-Donalda, Victoria Village)
| Sept 2013 | Sept 2014 | % Change | |
| Active Listings | 141 | 125 | – 11.4% |
| Sales | 59 | 81 | + 37.3% |
| Average Price | $644,694 | $767,182 | + 19.0% |
| Days on Market | 20 | 15 | – 25.0% |
| Avg % of List Price | 100 | 102 | + 2.0% |
Source: Toronto Real Estate Board


