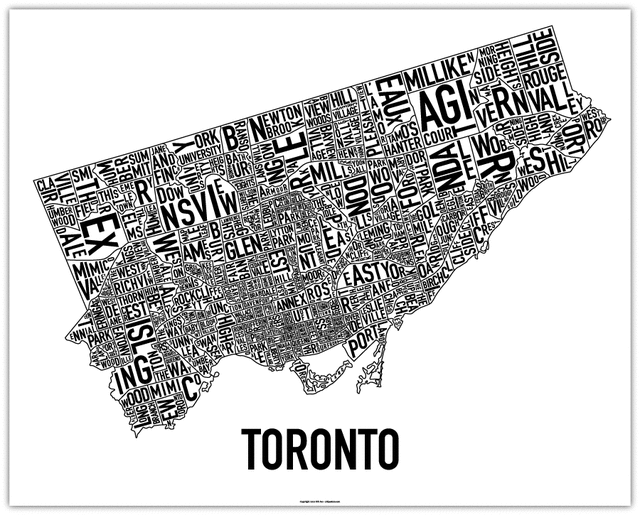
Toronto Neighbourhoods Under The Scope: June 2013
Find your neighbourhood below and see how May’s sales stats stacked up to last year’s.
C02 (Annex, Wychwood, Casa Loma, Yonge-St.Clair)
| May 2012 | May 2013 | % Change | |
| Active Listings | 278 | 312 | + 12.2% |
| Sales | 104 | 97 | – 6.7% |
| Average Price | $1,059,584 | $1,037,585 | – 2.1% |
| Days on Market | 19 | 25 | + 31.6% |
| Avg % of List Price | 101 | 97 | – 4.0% |
C03 (Forest Hill South, Cedarvale-Humewood, Oakwood-Vaughan, Yonge-Eglinton)
| May 2012 | May 2013 | % Change | |
| Active Listings | 115 | 127 | + 10.4% |
| Sales | 75 | 74 | – 1.3% |
| Average Price | $926,759 | $1,099,967 | + 18.7% |
| Days on Market | 18 | 20 | + 11.1% |
| Avg % of List Price | 100 | 100 | 0% |
C04 (Forest Hill North, Lawrence Park North/South, Bedford Park-Nortown, Englemount-Lawrence)
| May 2012 | May 2013 | % Change | |
| Active Listings | 245 | 275 | + 12.2% |
| Sales | 124 | 134 | + 8.1% |
| Average Price | $1,219,622 | $1,163,311 | – 4.6% |
| Days on Market | 20 | 22 | + 10.0% |
| Avg % of List Price | 99 | 100 | + 1.0% |
C06 (Clanton Park, Bathurst Manor)
| May 2012 | May 2013 | % Change | |
| Active Listings | 74 | 132 | + 78.4% |
| Sales | 34 | 39 | + 14.7% |
| Average Price | $709,203 | $610,772 | – 13.9% |
| Days on Market | 21 | 23 | + 9.5% |
| Avg % of List Price | 102 | 98 | – 4.0% |
C07 (Lansing-Westgate, Willowdale West, Newtonbrook West, Westminster-Branson)
| May 2012 | May 2013 | % Change | |
| Active Listings | 319 | 360 | + 12.9% |
| Sales | 137 | 123 | – 10.2% |
| Average Price | $622,006 | $676,072 | + 8.7% |
| Days on Market | 18 | 34 | + 88.9% |
| Avg % of List Price | 99 | 99 | 0% |
C09 (Rosedale-Moore Park)
| May 2012 | May 2013 | % Change | |
| Active Listings | 71 | 88 | + 23.9% |
| Sales | 47 | 44 | – 6.4% |
| Average Price | $1,395,330 | $1,126,088 | – 19.3% |
| Days on Market | 13 | 29 | + 123.1% |
| Avg % of List Price | 101 | 99 | – 2.0% |
C10 (Mount Pleasant East/West)
| May 2012 | May 2013 | % Change | |
| Active Listings | 129 | 143 | + 10.9% |
| Sales | 93 | 63 | – 32.3% |
| Average Price | $658,220 | $784,530 | + 19.2% |
| Days on Market | 15 | 19 | + 26.7% |
| Avg % of List Price | 101 | 101 | 0% |
C11 (Leaside, Thorncliffe Park, Flemingdon Park)
| May 2012 | May 2013 | % Change | |
| Active Listings | 92 | 86 | – 6.5% |
| Sales | 50 | 79 | + 58.0% |
| Average Price | $690,024 | $701,350 | + 1.6% |
| Days on Market | 18 | 20 | + 11.1% |
| Avg % of List Price | 102 | 100 | – 2.0% |
C12 (St. Andrew-Windfields, Bridle Path-Sunnybrook-York Mills )
| May 2012 | May 2013 | % Change | |
| Active Listings | 180 | 199 | + 10.6% |
| Sales | 43 | 52 | + 20.9% |
| Average Price | $1,898,216 | $1,722,437 | – 9.3% |
| Days on Market | 24 | 23 | – 4.2% |
| Avg % of List Price | 97 | 96 | – 1.0% |
C13 (Banbury-Don MIlls, Parkwoods-Donalda, Victoria Village)
| May 2012 | May 2013 | % Change | |
| Active Listings | 160 | 154 | – 3.8% |
| Sales | 99 | 83 | – 16.2% |
| Average Price | $617,082 | $631,423 | + 2.3% |
| Days on Market | 16 | 22 | + 37.5% |
| Avg % of List Price | 102 | 100 | – 2.0% |
Source: Toronto Real Estate Board


