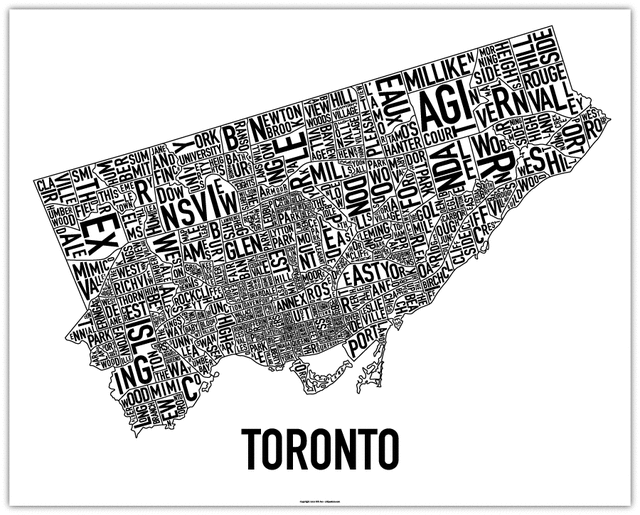
Toronto Neighbourhoods Under The Scope: July 2013
Find your neighbourhood below and see how June’s sales stats stacked up to last year’s.
C02 (Annex, Wychwood, Casa Loma, Yonge-St.Clair)
| June 2012 | June 2013 | % Change | |
| Active Listings | 263 | 293 | + 11.4% |
| Sales | 89 | 71 | – 20.2% |
| Average Price | $878,505 | $1,116,663 | + 13.3% |
| Days on Market | 20 | 26 | + 30.0% |
| Avg % of List Price | 100 | 98 | – 2.0% |
C03 (Forest Hill South, Cedarvale-Humewood, Oakwood-Vaughan, Yonge-Eglinton)
| June 2012 | June 2013 | % Change | |
| Active Listings | 112 | 115 | + 2.7% |
| Sales | 52 | 49 | – 5.8% |
| Average Price | $975,920 | $1,167,734 | + 19.7% |
| Days on Market | 14 | 14 | 0% |
| Avg % of List Price | 99 | 99 | 0% |
C04 (Forest Hill North, Lawrence Park North/South, Bedford Park-Nortown, Englemount-Lawrence)
| June 2012 | June 2013 | % Change | |
| Active Listings | 210 | 242 | + 15.2% |
| Sales | 102 | 102 | 0% |
| Average Price | $1,195,947 | $1,178,247 | – 1.5% |
| Days on Market | 21 | 22 | + 4.8% |
| Avg % of List Price | 99 | 98 | – 1.0% |
C06 (Clanton Park, Bathurst Manor)
| June 2012 | June 2013 | % Change | |
| Active Listings | 82 | 126 | + 53.7% |
| Sales | 28 | 39 | + 39.3% |
| Average Price | $659,451 | $567,354 | – 14.0% |
| Days on Market | 20 | 30 | + 50.0% |
| Avg % of List Price | 99 | 98 | – 1.0% |
C07 (Lansing-Westgate, Willowdale West, Newtonbrook West, Westminster-Branson)
| June 2012 | June 2013 | % Change | |
| Active Listings | 352 | 364 | + 3.4% |
| Sales | 110 | 98 | – 10.9% |
| Average Price | $628,725 | $608,554 | – 3.2% |
| Days on Market | 21 | 29 | + 38.1% |
| Avg % of List Price | 99 | 98 | – 1.0% |
C09 (Rosedale-Moore Park)
| June 2012 | June 2013 | % Change | |
| Active Listings | 66 | 79 | + 19.7% |
| Sales | 28 | 26 | – 7.1% |
| Average Price | $1,608,161 | $1,354,361 | – 15.8% |
| Days on Market | 22 | 25 | + 13.6% |
| Avg % of List Price | 97 | 97 | 0% |
C10 (Mount Pleasant East/West)
| June 2012 | June 2013 | % Change | |
| Active Listings | 127 | 125 | – 1.6% |
| Sales | 71 | 70 | – 1.4% |
| Average Price | $665,550 | $677,358 | + 1.8% |
| Days on Market | 14 | 24 | + 71.4% |
| Avg % of List Price | 103 | 100 | – 3.0% |
C11 (Leaside, Thorncliffe Park, Flemingdon Park)
| June 2012 | June 2013 | % Change | |
| Active Listings | 86 | 78 | – 9.3% |
| Sales | 34 | 46 | + 35.3% |
| Average Price | $666,889 | $704,355 | + 5.6% |
| Days on Market | 17 | 25 | + 47.1% |
| Avg % of List Price | 98 | 98 | 0% |
C12 (St. Andrew-Windfields, Bridle Path-Sunnybrook-York Mills )
| June 2012 | June 2013 | % Change | |
| Active Listings | 162 | 190 | + 17.3% |
| Sales | 55 | 36 | – 34.5% |
| Average Price | $1,980,413 | $1,955,006 | – 1.3% |
| Days on Market | 34 | 29 | – 14.7% |
| Avg % of List Price | 96 | 92 | – 4.0% |
C13 (Banbury-Don MIlls, Parkwoods-Donalda, Victoria Village)
| June 2012 | June 2013 | % Change | |
| Active Listings | 157 | 155 | – 1.3% |
| Sales | 94 | 93 | – 1.1% |
| Average Price | $577,508 | $635,509 | + 10.0% |
| Days on Market | 19 | 24 | + 26.3% |
| Avg % of List Price | 101 | 101 | 0% |
Source: Toronto Real Estate Board

